
Debugging
1 left after this
Debugging
- Console Debugging, Use console.log to track game state, variables, method calls Code review: Strategic logging in update/collision methods
- Hit Box Visualization, Draw/visualize collision boundaries to refine detection Demo: Toggle hit box display, adjust collision rectangles
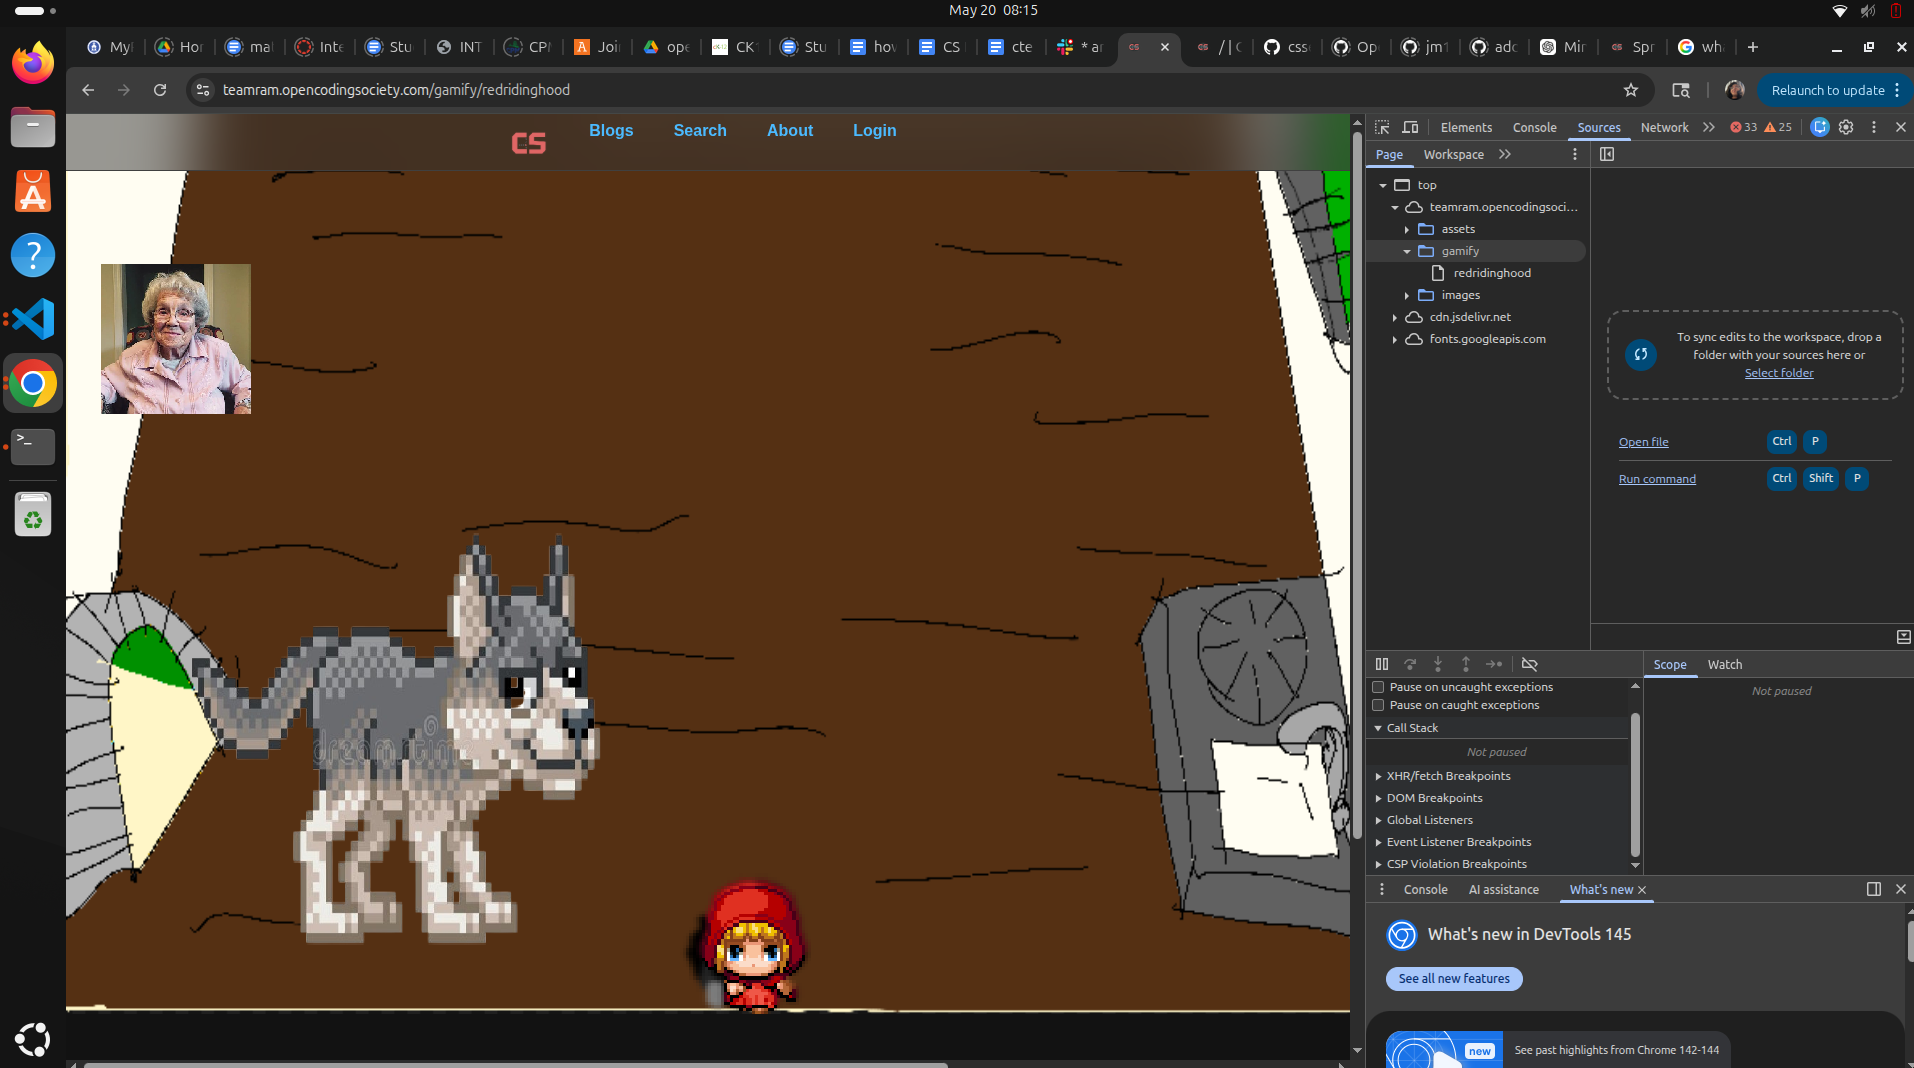
- Source-Level Debugging, Set breakpoints in DevTools, step through code execution Demo: Use Sources tab to pause and inspect code flow
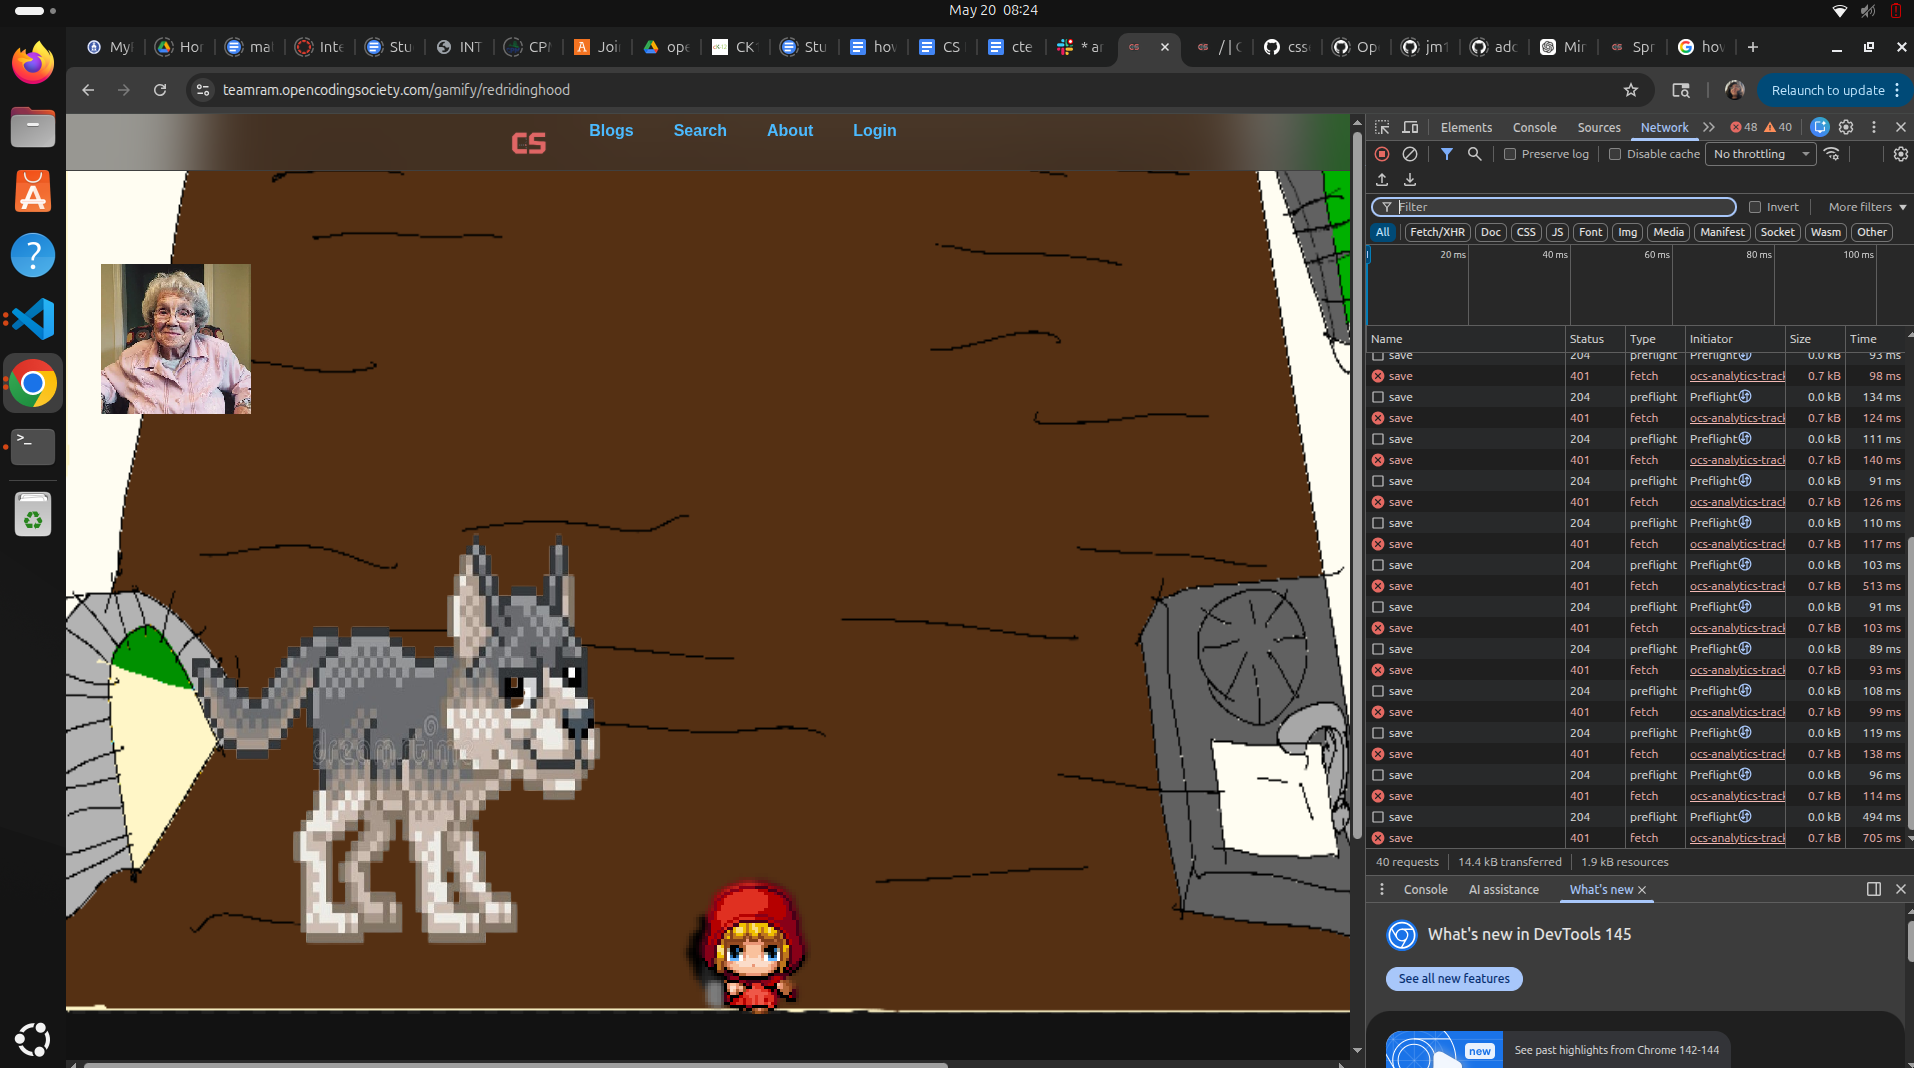
- Network Debugging, Examine Network tab for API calls, CORS errors, response status Demo: Inspect fetch requests, response data, error messages
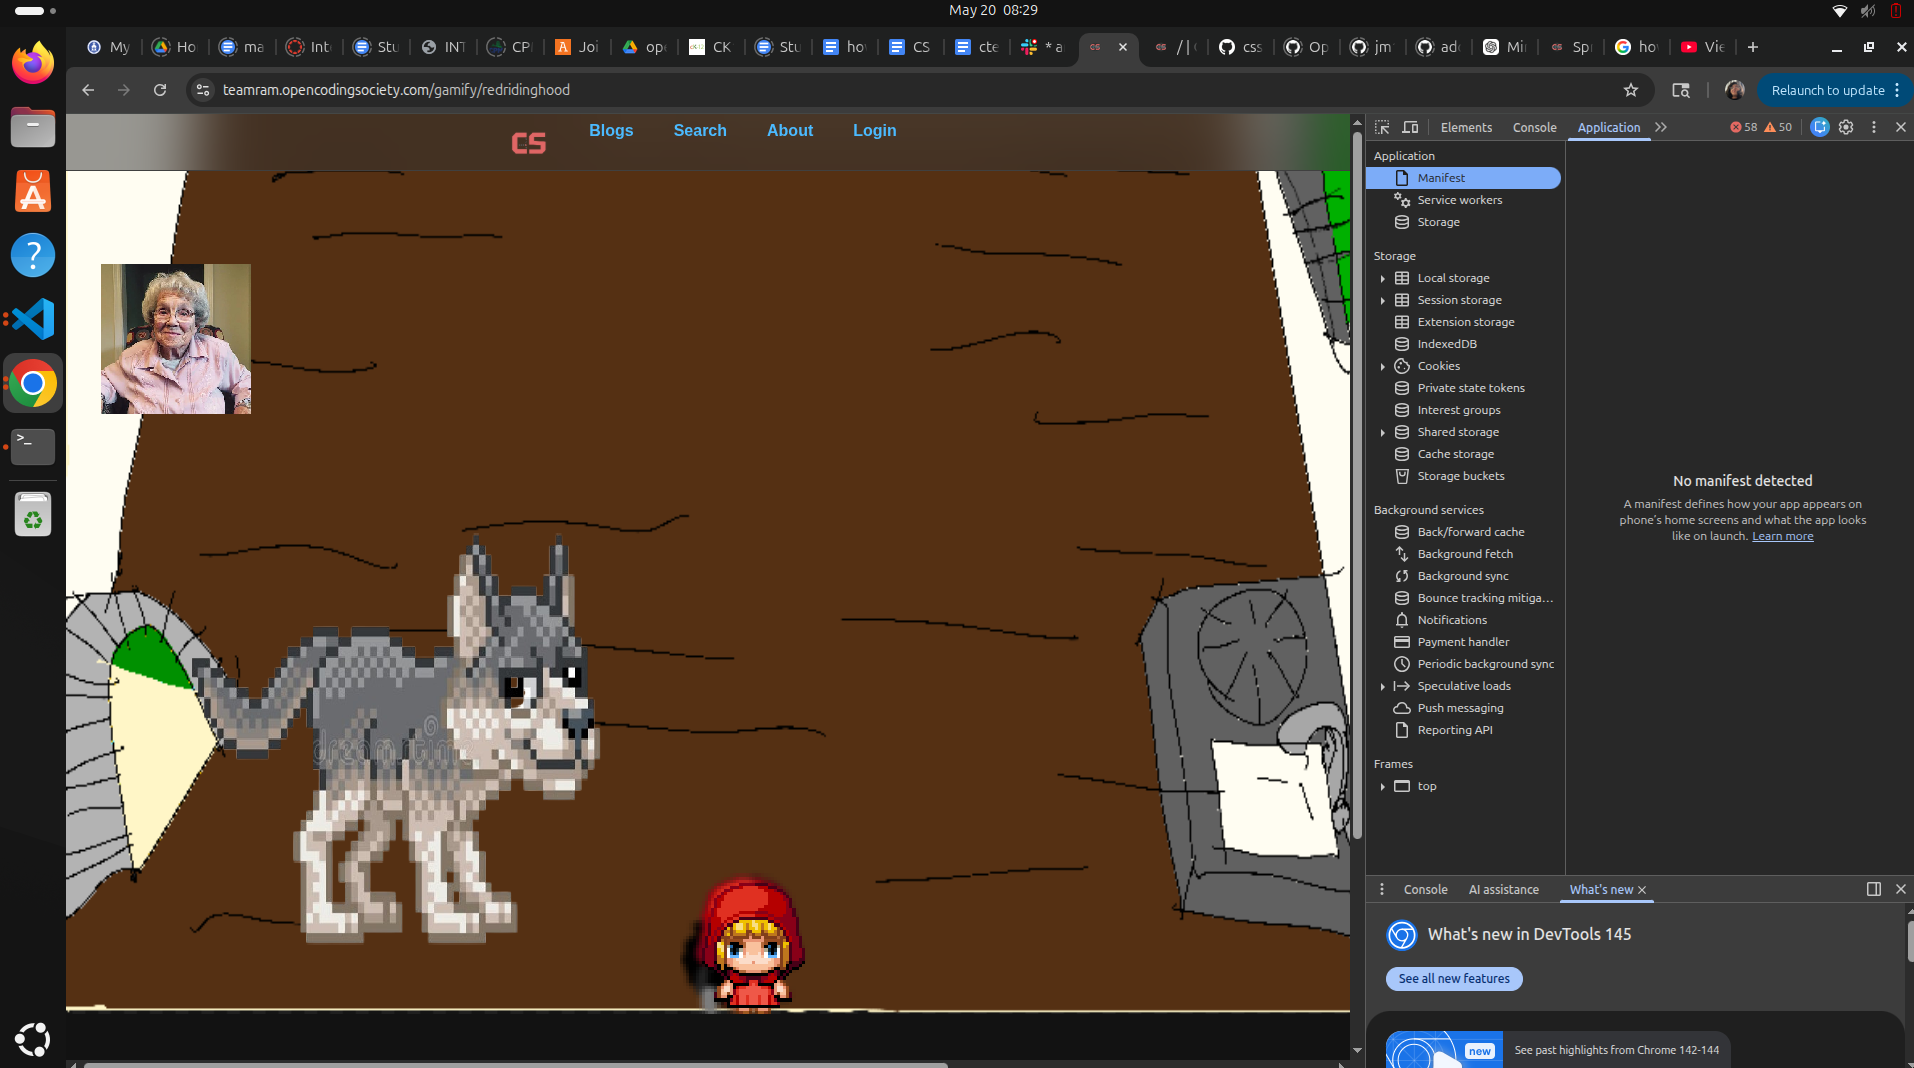
- Application Debugging, Examine cookies, localStorage, session data for login/state Demo: Application tab inspection of stored data
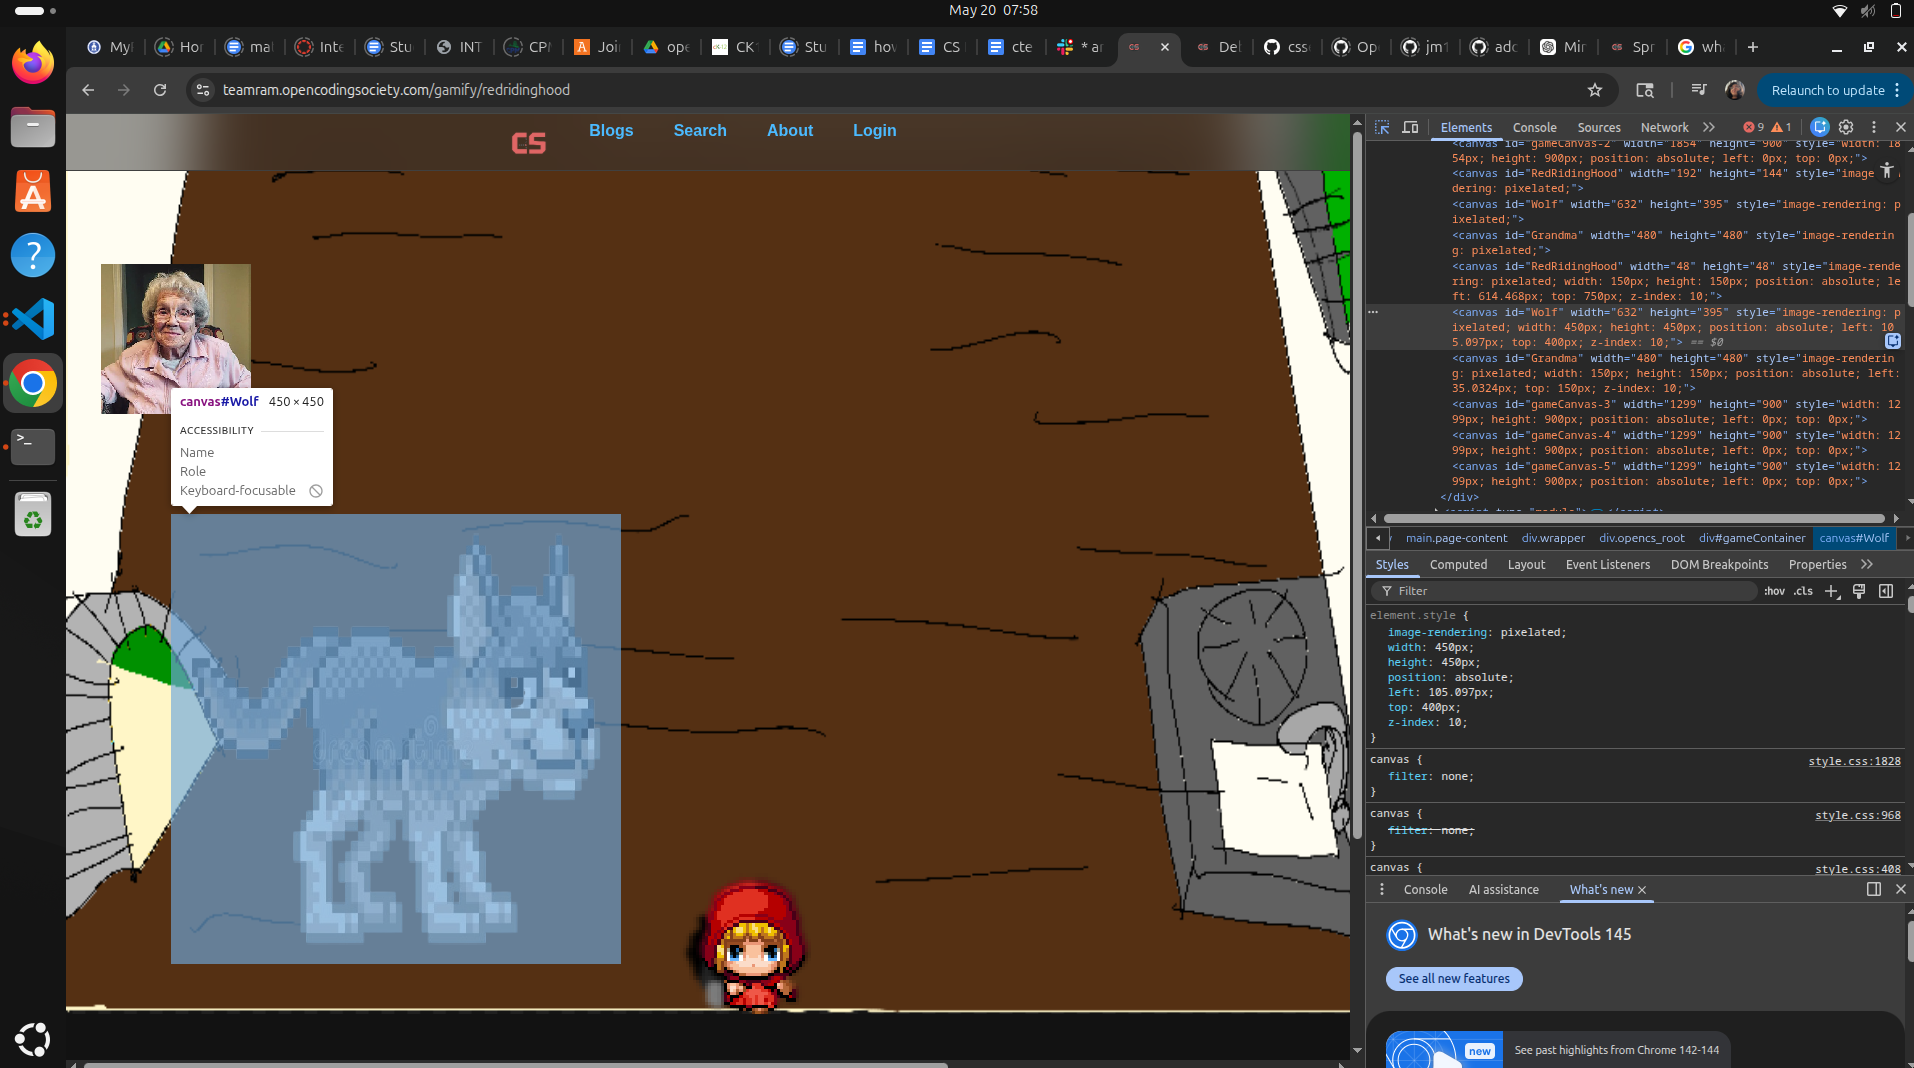
- Element Inspection, Use Element Viewer to inspect canvas, DOM elements, styles Demo: Inspect element properties and game object state
Console Debugging
- Opening Chrome DevTools Method 1
Right click the page → Inspect
Method 2
Keyboard shortcuts:
Windows/Linux Ctrl + Shift + I Mac Cmd + Option + I
Then click the Console tab.
- What the Console Does
The Console:
displays errors prints variables tracks game events logs collisions shows API responses helps debug movement and animations
- Basic console.log()
Example:
console.warn('Failed to load sprite sheet:', data.src, e);
Appears if in the (specified by character.js) sprite sheet fails to load after checks and other console logs proven unused
console debugging focuses on the ability to check the console to see stuff going on in game using the console by inspecting the page to find important details of whats going on in game, I do have, code that logs stuff for the console and here are images of it too
   showInstructions() {
        console.log("=== LEVEL 3: FACE THE WOLF ===");
        console.log("WASD - Move Red Riding Hood");
        console.log("Q - Shoot bullets");
        console.log("Defeat the wolf in the upper middle!");
        console.log("============================");
    }
Hit Box Visualization
this asks for their to be a feature to showcase the hit box toggle I don’t believe this was something incorporated, you can kind of see them using the console but it’s not their actual actual hit boxes. I know level 2 had something similar but it’s not toggle-able.
Source-level Debugging
Source-level debugging was performed using Chrome DevTools’ Sources tab. Breakpoints were set in movement, collision, and animation methods to pause execution and inspect variables such as position, velocity, and collision data. Stepping through code line-by-line helped identify gameplay bugs and verify logic flow during runtime.
Source-Level Debugging Guide for Games in Chrome
Source-level debugging means using the Sources tab in Chrome DevTools to:
pause code execution inspect variables step through functions line-by-line track game logic in real time
This directly matches your rubric requirement:
“Set breakpoints in DevTools, step through code execution”
- Open Chrome DevTools Shortcut Windows/Linux Ctrl + Shift + I Mac Cmd + Option + I
Then click:
Sources
- Find Your JavaScript File
In the left panel:
open your site files navigate to: Player.js Character.js Enemy.js
Click the file you want to debug.
- Set a Breakpoint
A breakpoint pauses the game at a specific line.
How
Click the line number.
Example:
this.velocity.x += this.xVelocity;
A blue marker appears.
When the code reaches that line:
the game pauses DevTools stops execution
- Inspect Variables
While paused:
hover variables view values in the right panel inspect objects
Example:
this.position this.velocity this.direction
You can see:
player coordinates movement speed collision states animation frames
- Example With Your Player Code
Suppose you set a breakpoint here:
updateVelocity() {
Now when movement happens:
game pauses you inspect: pressedKeys velocity direction
This helps debug:
movement bugs stuck movement incorrect controls
- Debugging Collisions
Set a breakpoint here:
handleCollisionReaction(other)
When collision occurs:
game pauses instantly inspect: other touchPoints velocity
Perfect for debugging walls and enemy collisions.
- Debugging Animation
Breakpoint example:
updateAnimationFrame()
Inspect:
frameIndex frameCounter direction
Useful for:
broken animations wrong sprite rows animation timing
- Watch Expressions
In the right panel: Add watches like:
this.position.x this.velocity.y this.direction
Chrome updates them live while debugging.
- Pausing on Errors
In Sources: Enable:
Pause on exceptions
Now Chrome automatically pauses when:
code crashes undefined variables occur APIs fail
Very useful.
- Debugging Game Loops
Games update constantly, so:
breakpoints pause the loop you can inspect the exact frame where bugs happen
This is extremely useful for:
collision bugs teleporting physics glitches animation issues
- Example Workflow Problem:
Player clips through wall.
Debug Process: Open Sources Set breakpoint in: handleCollisionReaction() Move into wall Game pauses Inspect: touchPoints velocity position Find incorrect collision logic
This is real source-level debugging.
Network Debugging
- Open Chrome DevTools Shortcut Windows/Linux Ctrl + Shift + I Mac Cmd + Option + I
Then click:
Network
- Reload the Game
Press:
F5
or refresh the page.
The Network tab now records:
images JavaScript files APIs sounds fetch requests
- Understanding the Network Tab
Each request shows:
file/API name request type status code file size loading time
- Important Status Codes Code Meaning 200 Success 404 File not found 500 Server error 403 Forbidden 401 Unauthorized
Example:
404 leaderboard API
means the request failed.
- Debugging API Requests
Suppose your game saves scores:
fetch(“/api/leaderboard”)
In Network:
click the request inspect details
You can see:
request headers response body errors JSON data
- Inspecting JSON Responses
Click:
Preview
or:
Response
You can inspect returned leaderboard data like:
[ { “name”: “Alex”, “score”: 500 } ]
This demonstrates:
JSON parsing backend communication API integration
- Debugging Failed Requests
If a request fails:
it appears red in Network
Example errors:
404 Not Found 500 Internal Server Error CORS Error
This helps identify:
broken API URLs backend issues missing assets
- Debugging Asset Loading
Games load many assets:
sprites sounds backgrounds
Network helps find missing files.
Example:
player.png 404
Means:
image path incorrect asset missing
- Filtering Requests
Use filters:
Fetch/XHR → APIs Img → sprites/images JS → scripts
Very useful for large games.
- Example Using Your Project
Suppose sprite fails to load:
this.spriteSheet.src = data.src;
Network debugging lets you:
check image request verify path inspect loading failure
- Debugging API Error Handling
Your rubric wants this specifically.
Example:
try { const response = await fetch(“/api/leaderboard”); } catch (error) { console.error(error); }
Then in Network:
inspect failed request verify status code analyze response
This is full API/network debugging.
- Simulating Slow Internet
In Network: Change:
No throttling
to:
Slow 3G Fast 3G
This helps test:
loading screens async behavior lag handling
Very useful for games.
- Preserve Logs
Enable:
Preserve log
This keeps requests visible after page refresh.
Helpful for debugging startup/loading issues.
- Example Debug Workflow Problem:
Leaderboard not saving.
Steps: Open Network tab Filter Fetch/XHR Submit score Inspect request Check: status code response body request payload
You may discover:
wrong API URL missing JSON server failure
Application Debugging
- Open Chrome DevTools Shortcut Windows/Linux Ctrl + Shift + I Mac Cmd + Option + I
Then click:
Application
- What the Application Tab Does
The Application tab lets you inspect browser-stored data.
Games often store:
player progress high scores settings login information save states
- localStorage Debugging
Many games use:
localStorage.setItem(“score”, 500);
to save data.
Viewing localStorage
In DevTools:
Application → Local Storage
Select your website.
You’ll see:
keys values stored game data
Example:
Key Value score 30 playerName AVG
- Example Game Save System
Saving data:
localStorage.setItem(“highScore”, score);
Loading data:
const highScore = localStorage.getItem(“highScore”);
- Why This Helps Debugging
You can verify:
scores save correctly settings persist game state updates values are not corrupted
- Editing Stored Data
In the Application tab:
double click a value edit it live
Example: Change:
highScore = 999999
Useful for:
testing debugging edge cases verifying game behavior
- Removing Broken Data
You can delete storage entries if:
save files break old data causes bugs testing needs reset
Right click → Delete
- sessionStorage
Similar to localStorage but temporary.
Data disappears when tab closes.
Example:
sessionStorage.setItem(“currentLevel”, 3);
Useful for:
temporary sessions checkpoints current match state
- Cookies
Games/web apps may use cookies for:
login sessions authentication preferences
View them under:
Application → Cookies
- Cache Storage
Games often cache:
images sounds scripts
Application tab helps inspect:
cached assets service workers offline behavior
Elemental Inspection
Element Inspection Guide for Games in Chrome
Element inspection uses the Elements tab in Chrome DevTools to inspect and debug:
HTML elements canvas positioning styles game UI hitboxes DOM structure
This directly matches your rubric requirement:
“Inspect canvas, DOM elements, styles, and game object state”
- Open Chrome DevTools Shortcut Windows/Linux Ctrl + Shift + I Mac Cmd + Option + I
Then click:
Elements
- What the Elements Tab Does
The Elements tab lets you inspect:
webpage structure canvas elements CSS styles game UI components dynamically created objects
For games, this is useful because many objects are drawn or controlled through the DOM.
- Selecting Elements
Click the cursor icon:
Select an element
Then click something on the page.
Chrome highlights:
the HTML element styles dimensions positioning
- Inspecting the Game Canvas
Your project creates canvases dynamically:
this.canvas = document.createElement(“canvas”);
In Elements you can inspect:
canvas size position styles z-index visibility
- Inspecting CSS Styles
Your game uses styles like:
this.canvas.style.left = ${this.position.x}px;
In Elements:
see computed styles edit values live test positioning changes
Useful for debugging:
off-screen objects layering problems scaling issues
- Live Editing Styles
You can directly edit CSS in DevTools.
Example: Change:
width: 50px;
to:
width: 100px;
This updates instantly without refreshing.
Very useful for:
hitbox alignment UI testing scaling adjustments
- Inspecting Game Object State
Since your game stores object data in elements:
this.canvas.id = data.id;
you can inspect:
object IDs class names styles visibility
- Debugging Positioning Problems
Example issue:
player appears in wrong place
Inspect:
left top width height
inside Elements.
This helps debug:
movement bugs resize problems scaling calculations
- Viewing Canvas Dimensions
You can inspect:
canvas.width canvas.height
Useful for:
sprite scaling hitbox mismatch animation clipping
- Debugging Hidden Elements
If UI disappears:
inspect element visibility check: display visibility opacity z-index
Very common debugging step.
- Inspecting Touch Controls
Your code creates:
TouchControls
Element inspection can verify:
buttons exist positions are correct controls appear on mobile
- Example Debug Workflow Problem:
Player sprite appears off-screen.
Steps: Open Elements Select canvas Inspect: left top width height Find incorrect positioning value Adjust/test live
Element inspection was performed using Chrome DevTools’ Elements tab to inspect canvas objects, UI components, and CSS styles during gameplay. This allowed debugging of positioning, scaling, visibility, layering, and dynamically generated game elements by examining DOM structure and live style properties.
simply speaking: you inspect with right click, go to the elements tab, press the ctrl+shift+c button thats like a square with a mouse on it and it lets you click elements on the game to check their code mainly image files, yeah btw elements mainly shows off code.
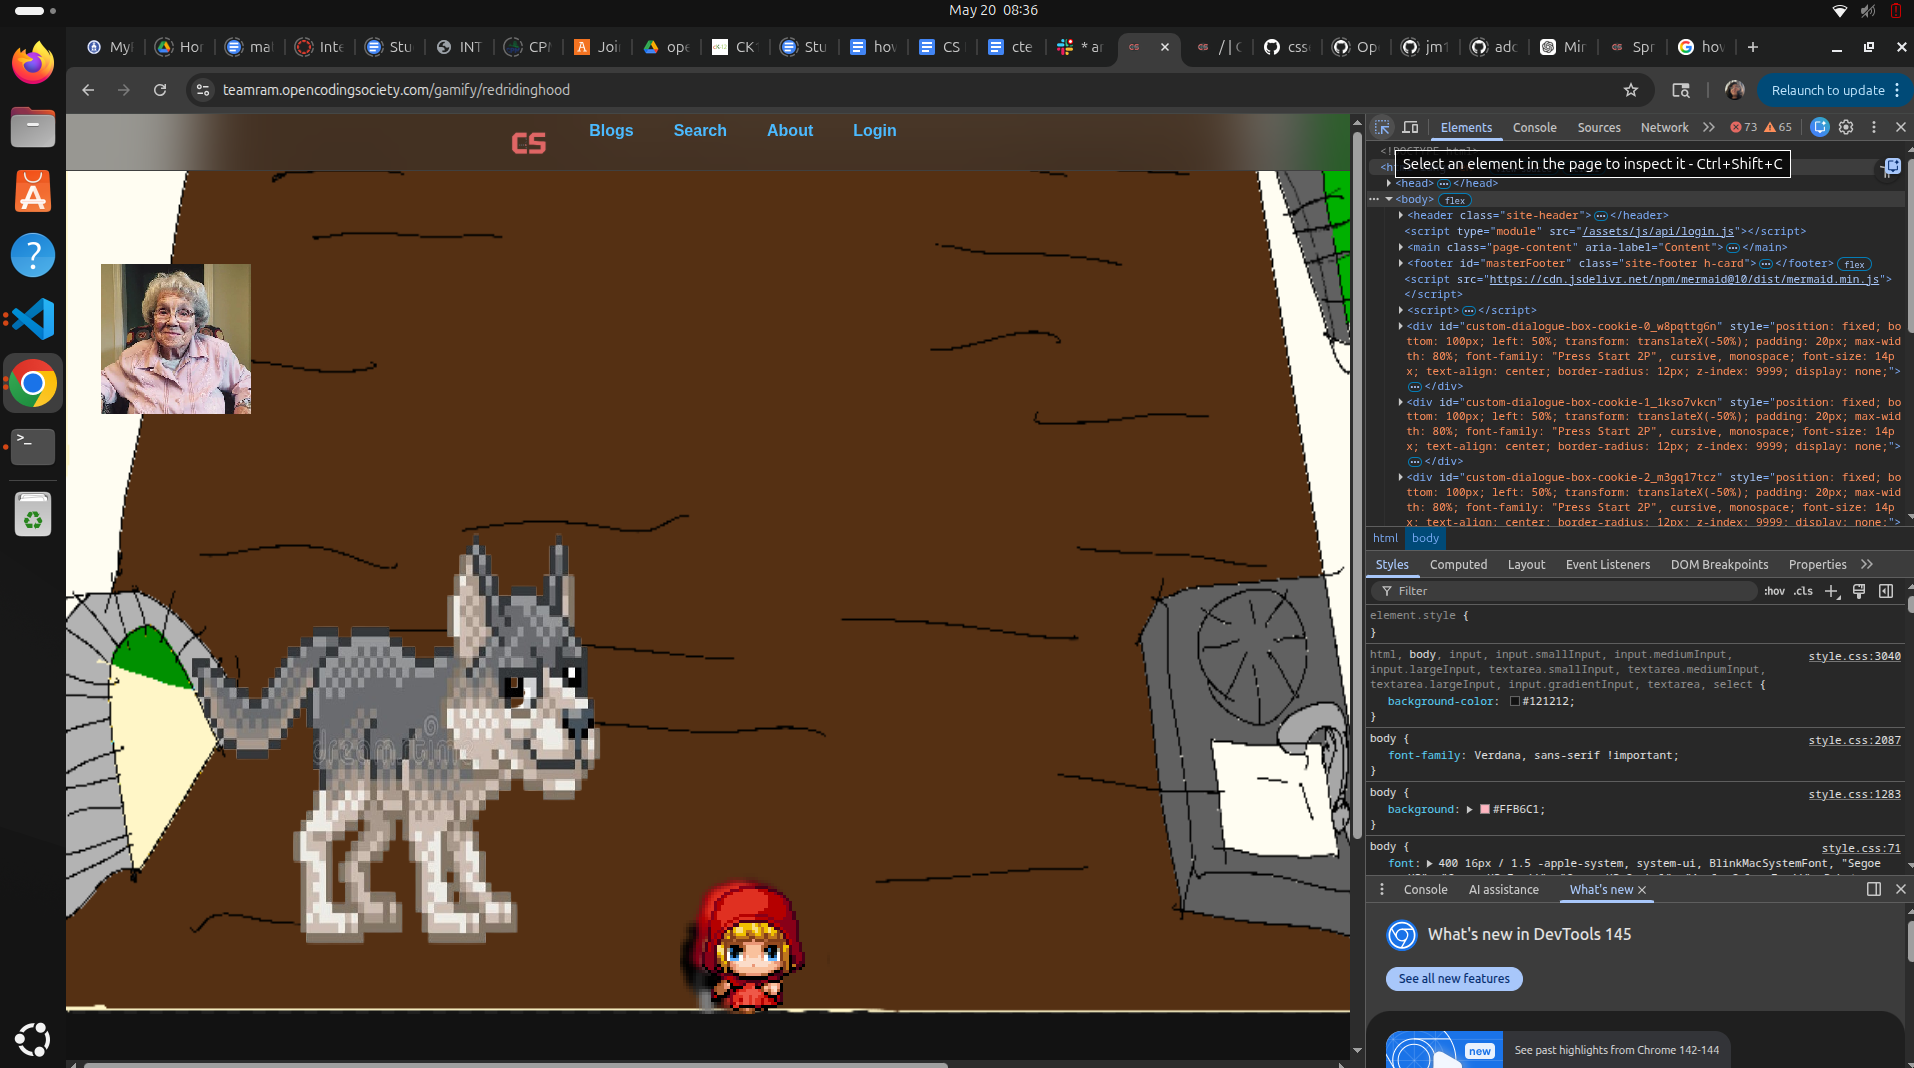
Element inspection was performed using Chrome DevTools’ Elements tab to inspect canvas objects, UI components, and CSS styles during gameplay. This allowed debugging of positioning, scaling, visibility, layering, and dynamically generated game elements by examining DOM structure and live style properties.